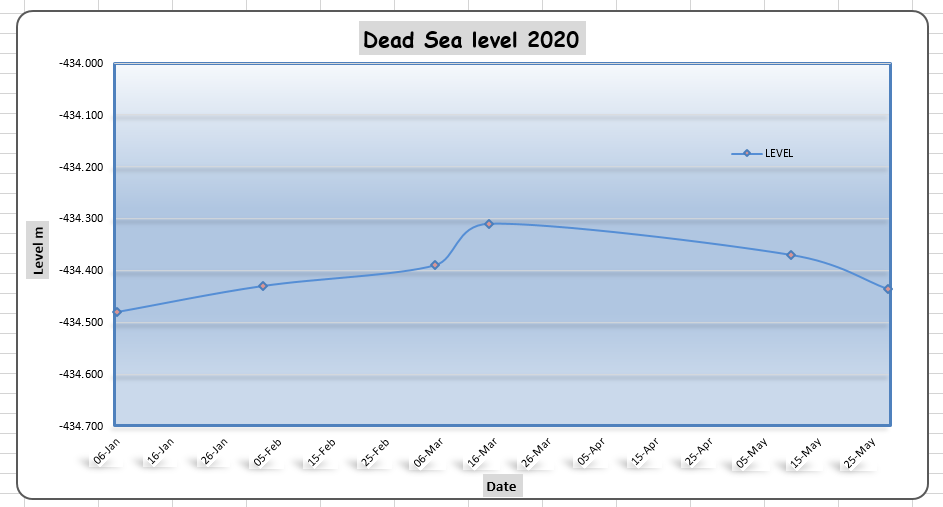
- Dead Sea Level:
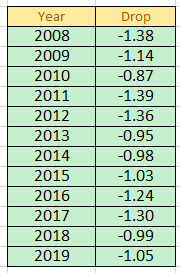
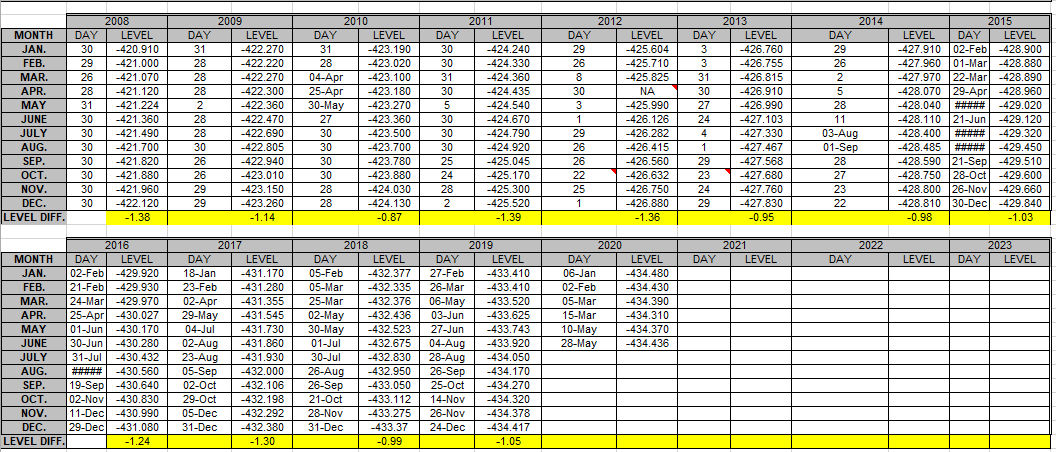
- The average drop of Dead Sea from year 2008 to 2019 is 114 cm.
- The maximum drop at Dead Sea level was 139 cm in year 2011.
- The minimum drop at Dead Sea level was 87 cm in year 2010.
|
Year |
2008 |
2009 |
2010 |
2011 |
2012 |
2013 |
2014 |
2015 |
2016 |
2017 |
2018 |
2019 |
Avg. |
Max. |
Min. |
|
Drop m |
-1.38 |
-1.14 |
-0.87 |
-1.39 |
-1.36 |
-0.95 |
-0.98 |
-1.03 |
-1.24 |
-1.30 |
-0.99 |
-1.05 |
-1.14 |
-0.87 |
-1.39 |
|
Drop cm |
-137.7 |
-114.0 |
-87.0 |
-139.0 |
-136.0 |
-95.0 |
-98.0 |
-103.0 |
-124.0 |
-130.0 |
-99.0 |
-104.7 |
-114.0 |
-87.0 |
-139.0 |
- Dead Sea Brine Conductivity, TDS &
- Based on the Dead Sea Brine Water Chemistry and Physical Parameters Prepared with coordination with PFC-DSEER; Mutah University
- Four locations of the Dead Sea were investigated.
- Two shallow locations (10 m) and (25 m) and two deep locations (220 m) and (250 m).
The coordination and depth of sampling locations
|
Location |
East |
North |
Depth (m) |
No. samples |
|
D1 |
35.456674 |
31.336563 |
10 |
3 |
|
D2 |
35.522891 |
31.352345 |
25 |
6 |
|
D3 |
35.541075 |
31.480365 |
220 |
45 |
|
D4 |
35.492155 |
31.501584 |
250 |
51 |
|
Surface |
1 |
27 |
|
|
|
- Analytical methods for Dead Sea samples/ PFC labs.
- Salinity:
The salinity of DS brine samples rages 341-385 PSU with average 360 PSU. Previous analyses (2008) found it 339.3 PSU (Khlaifat et al. 2010); and in (2015) 350 PSU (2015 MSS report). While in this study, it shows continuous increase up to 360 PSU. At D3 profile, there are clear 2-layers of high salinity with average 372 and 370 PSU respectively downward. These two layers correlated well with previously mentioned density pattern of profile D3. This might be attributed to the continuous drop in DS level and area shrinkage that increases its salinity in rapid rate.
-
- pH
The pH have shown stratification feature as the upper 10 m have pH=6.13, while it increases to pH=6.18 downward, and continued increasing up to 6.22 at bottom brine water. The increase in pH marked an increase in alkaline elements; particularly (Mg++ and Na+) at D4 profile content toward the bottom brine water.
-
- EC:
EC ranges 468.6 mS to 521.6 mS with an average 490.6 mS. Generally it increases downward. The EC pattern in the four profiles shown almost the similar pattern of salinity. As it is a measure of EC forms by the salt content in the measured samples.
-
- TDS & TSS:
It is obvious that TDS at shallower brine water is higher than at deeper brine water Meanwhile, TSS has nearly opposite pattern. This means that samples with higher TDS have low TSS and vice versa. It can be explained as a function of solubility and it seems that temperature have role in increasing the solubility of upper brine water layer, thus raises the TDS content.
- Analytical methods for Dead Sea samples/ APC labs as per June 2020
